Who trades a TON jetton: top traders, transfers and the market maker dashboard

The jetton page has three tabs that show who moves the token (Top traders, Top transfers and First transactions) and a separate dashboard that shows how the underlying analysis run went. Holder distribution tells you who owns a token; these pages tell you who trades it. Together they answer whether a market is organic or driven by a handful of wallets. Read how to analyse a jetton first if you have not. The examples use DOGS, data as of November 17, 2026.
Where the data comes from
Trader data comes from an analysis run: the portal collects the jetton’s trading wallets over a period (here a 30-day run of November 9, 2026) and loads each wallet’s event history. The tabs show which run the numbers come from (“From the 30 days run of …”) and let you pick a period: 24h, 7 days, 30 days, 1 year or all time. Everything is a snapshot, not a live feed.
Step 1. Top traders
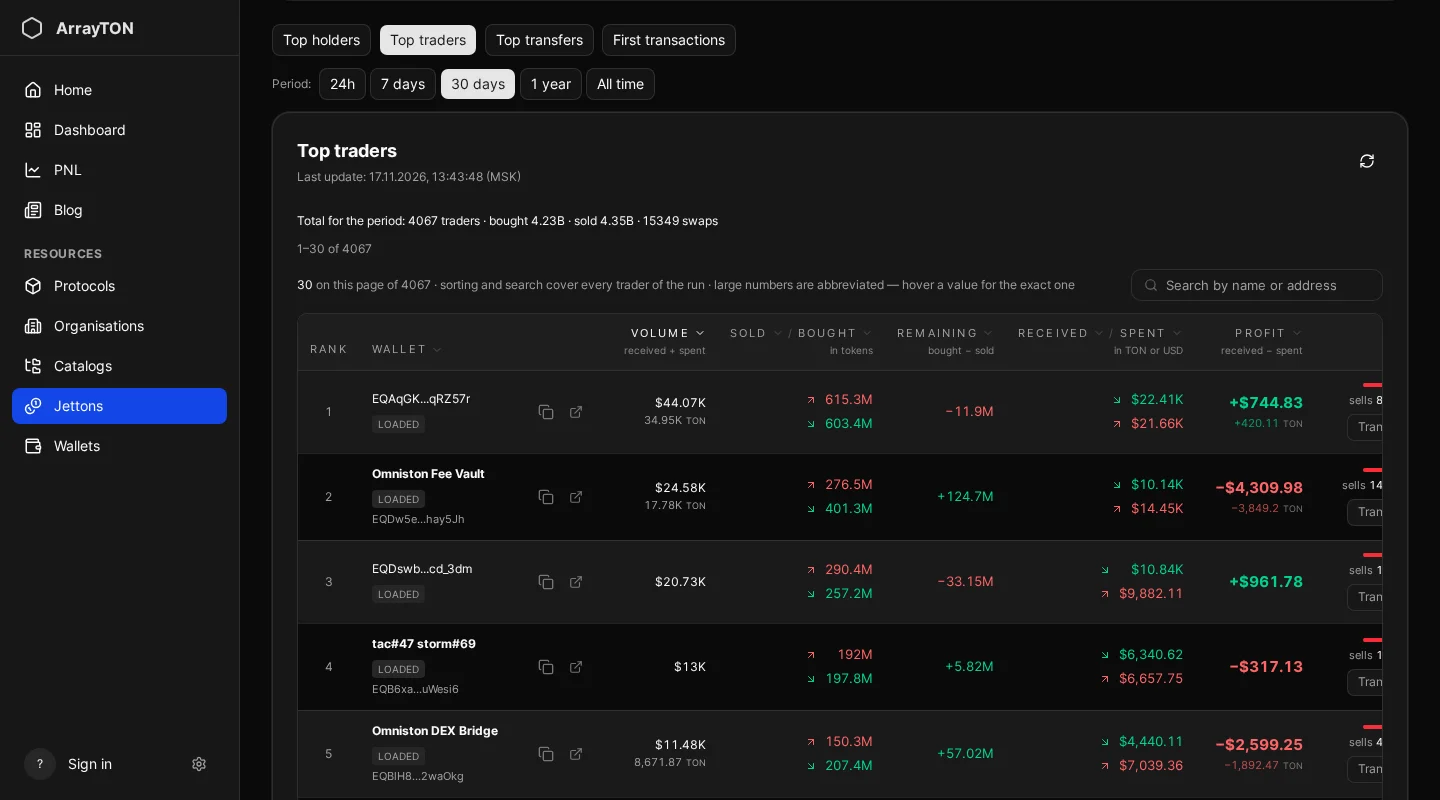
Open the Top traders tab on the jetton page. The header shows totals for the period: number of traders, tokens bought and sold, number of swaps. The table lists every wallet that swapped the jetton:
| Column | Meaning |
|---|---|
| Rank, Wallet | Position and the address or its label; a LOADED badge means its history is fully loaded |
| Volume | Received plus spent: how much the wallet moved in total |
| Sold / Bought | Token amounts |
| Remaining | Bought minus sold |
| Received / Spent | Amounts in TON or USD |
| Profit | Received minus spent |
| Swaps | Number of sells and buys, with a Transactions button for the details |
Sorting and search cover all traders of the run, not just the visible page. Large numbers are abbreviated; hover a value for the exact one. The refresh icon reloads the table.
Profit here is a cash difference, not a valuation of what the wallet still holds. A positive Profit with a large Remaining may be an open position.
Step 2. Top transfers: wallets without swaps
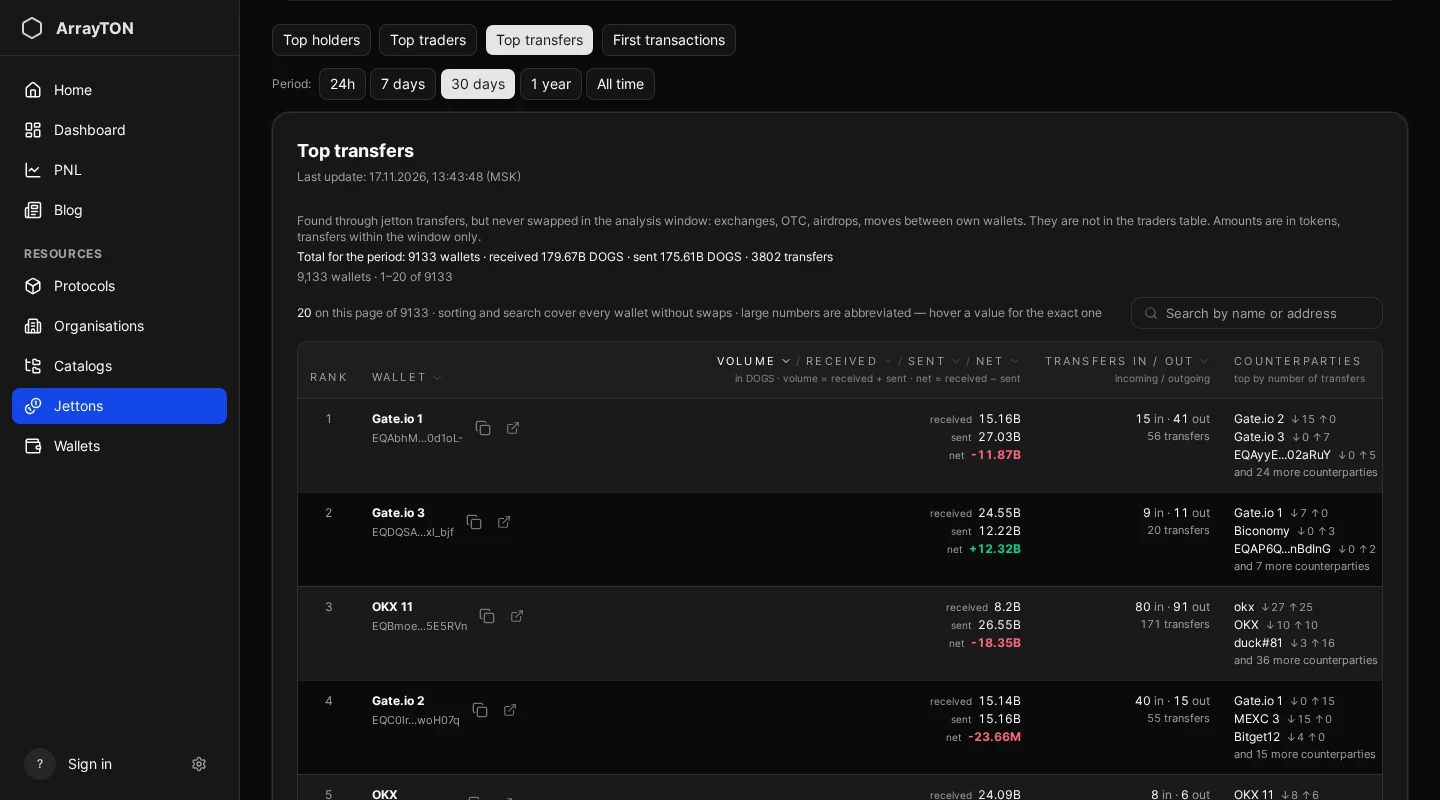
The Top transfers tab lists wallets that appear through jetton transfers but never swapped in the analysis window. They are typically exchanges, OTC desks, airdrop distributors or someone moving tokens between their own wallets. They are not in the traders table.
Columns show volume, received, sent, net (received minus sent), transfers in and out, top counterparties and the period from the first to the last transfer in UTC. Amounts are in tokens. A large net outflow to many counterparties looks like distribution; a large net inflow into one wallet can be accumulation. In the example, a chain of wallets passes the same 267M tokens along within hours, which is typical for an exchange moving funds between its own addresses. Open a wallet to find out who it is, see how to analyse a wallet.
Step 3. First transactions
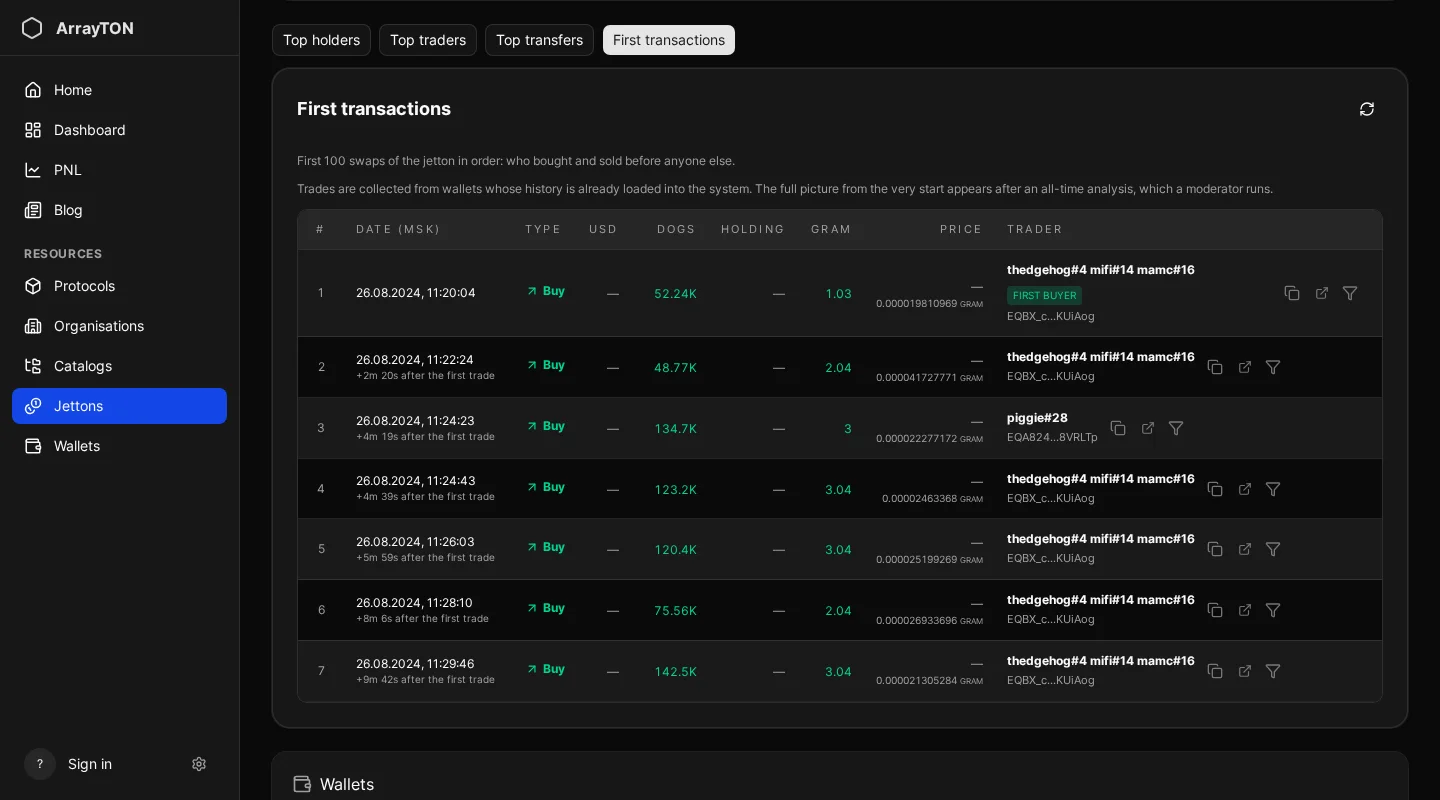
The First transactions tab shows the first 100 swaps of the jetton in order: who bought and sold before anyone else. Each row has the date, the type (buy or sell), amounts, price, the trader and the transaction link, and later rows show how long after the first trade they happened. The first buyer is marked. Trades come from wallets whose history is already loaded, so the full picture from the very start appears only after an all-time analysis, which a moderator runs.
How to use it: see whether the early buyers are still holders (compare with Top holders) and whether the first minutes were dominated by one wallet.
Step 4. The market maker dashboard
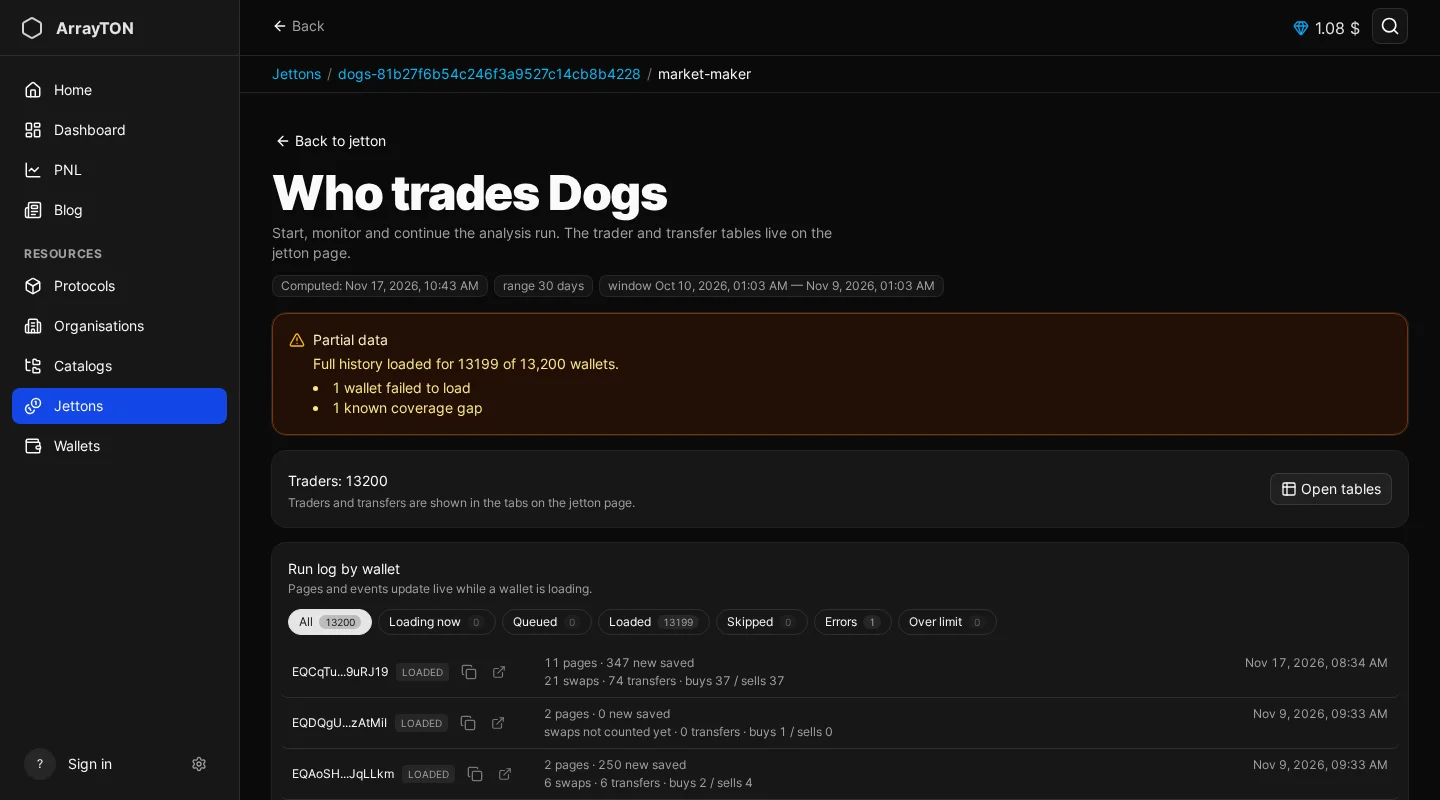
The Market maker dashboard button in the jetton header opens the page “Who trades {jetton}”. It is where the analysis run is started, monitored and continued; the tables themselves live on the jetton page, and the Open tables button takes you back to them. Here you see:
- When the run was computed, its range (for example 30 days) and its time window.
- A Partial data warning if some wallets failed to load or have coverage gaps, for example “history loaded for 13,199 of 13,200 wallets”.
- The number of traders in the run.
- A run log by wallet with filters (All, Loading now, Queued, Loaded, Skipped, Errors, Over limit), showing pages and events loaded, swaps, transfers and buys and sells per wallet.
Use it to judge how complete the data is before drawing conclusions.
What to look for
- Concentration: do the top 3 wallets make most of the volume?
- Round trips: high volume with Profit near zero and many buys and sells may be liquidity providers or market makers.
- Winners: very high Profit on a small position may be early insiders; check their history.
- Coverage: many wallets without loaded history, or a Partial data warning, means the picture is incomplete.
Frequently asked questions
Is high volume with zero profit suspicious? Not by itself. Market makers earn from the spread and can look flat.
Why is a known exchange not in Top traders? Exchanges often move tokens by transfers, so they land in Top transfers.
Can I see a longer period? Use the period selector; the available data depends on the run.
This is an analysis tool, not investment advice.
Next step
Open a specific wallet from a table and read how to analyse a wallet.
All guides in this series
- Overview: what is on the portal
- How to analyse a jetton
- Who trades a jetton: market maker dashboard (you are here)
- How to analyse a wallet
- Wallet PnL from swaps
- Protocols, jettons, organisations and catalogs
- Favorites, profile and wallet linking
- Leaderboard and public profiles