How to analyse a TON jetton before you buy: holders, supply and red flags

To judge a TON jetton, answer three questions: is the contract safe, who holds the supply, and does the price history make sense. The jetton page on ArrayTON puts all three in one place. This guide walks through it in the order that saves the most time, using DOGS as the example (data as of November 17, 2026, so your numbers will differ). If you are new to the portal, start with the overview.
Step 1. Open the jetton page and read the header
Find the jetton through search (symbol, name or master address) or the Jettons section.
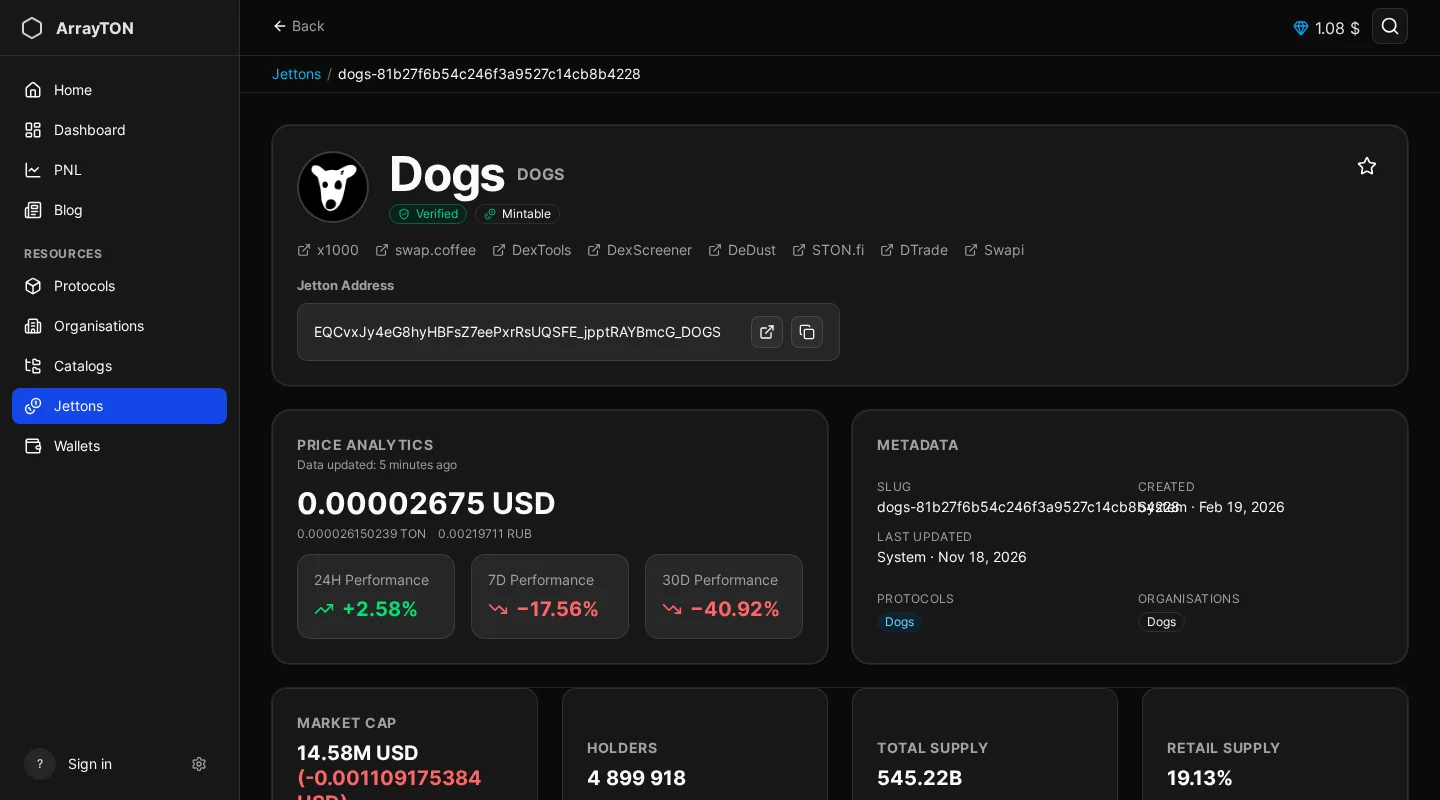
The header shows the name and symbol, status labels, quick links to external tools (DEX and chart services), the jetton address with copy and open buttons, and a star to add it to favorites.
| Label | What it tells you |
|---|---|
| Verified | The jetton is confirmed as the genuine one |
| Scam | Flagged as a scam, treat everything else with suspicion |
| Admin Burned | The admin role was renounced: the owner can no longer change the contract |
| Mintable | New tokens can still be minted |
| Hidden / Dead | Hidden from listings or no longer active |
Mintable together with an active admin means the supply can grow. Admin Burned means that risk is gone for the contract itself.
Step 2. Read the numbers under the header
Price Analytics shows the price in USD, TON and RUB and the 24H, 7D and 30D performance. The Metadata card shows the slug, creation and last update, and the protocols and organisations the jetton is linked to (see catalogs). Four tiles follow: Market Cap, Holders, Total Supply and Retail Supply.
A jetton with millions of holders and a verified label is a different case from one with a few hundred holders and no links. Empty protocol and organisation cards mean nobody has documented the project yet.
Step 3. Read the chart honestly
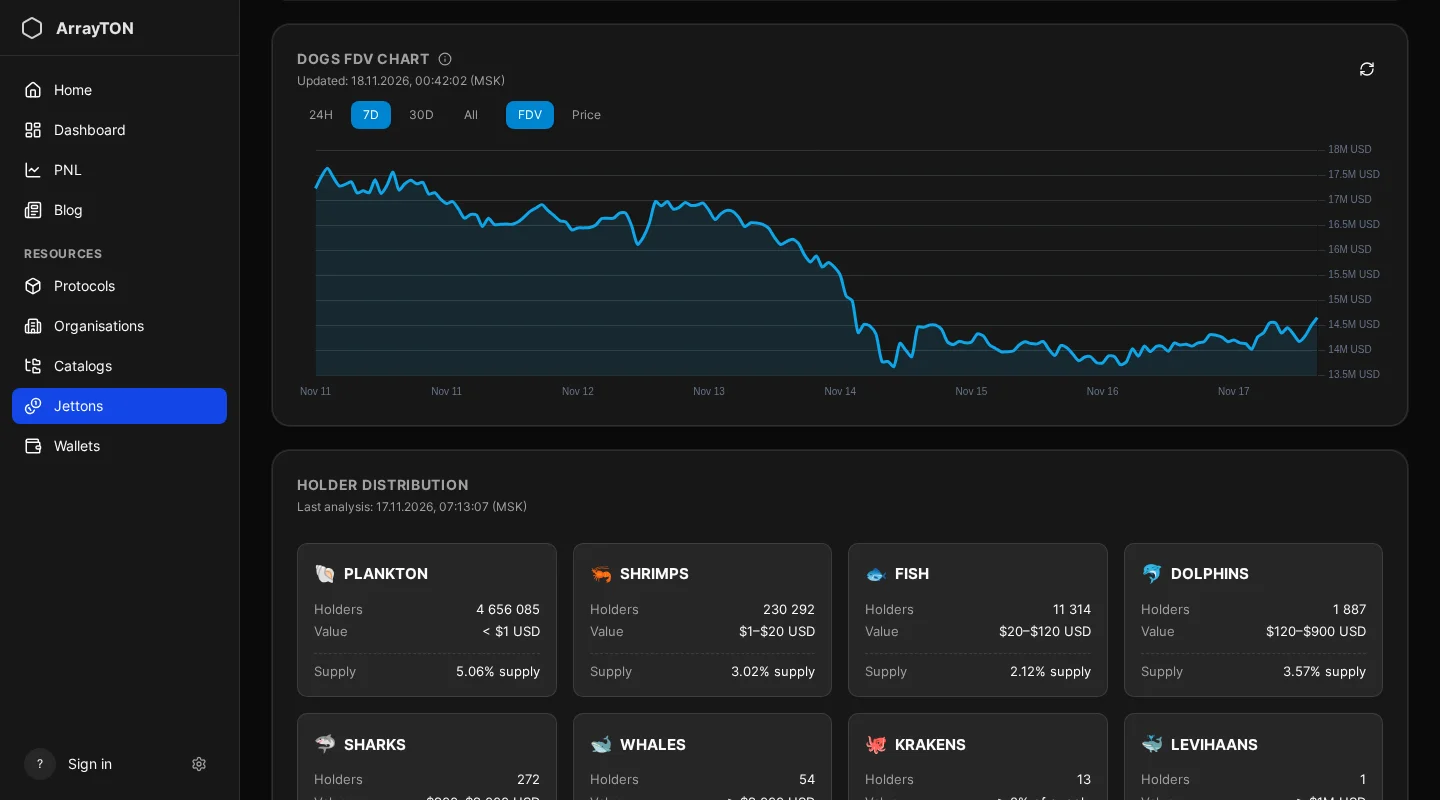
The chart switches between FDV and Price and between 24H, 7D, 30D and All. FDV (fully diluted valuation) is the price multiplied by the total supply. On the portal it is estimated from the current total supply, so it is approximate and can differ from other services. Use the chart for shape (a spike and a collapse, steady growth, a flat line), not for exact numbers.
Step 4. Look at the holder distribution
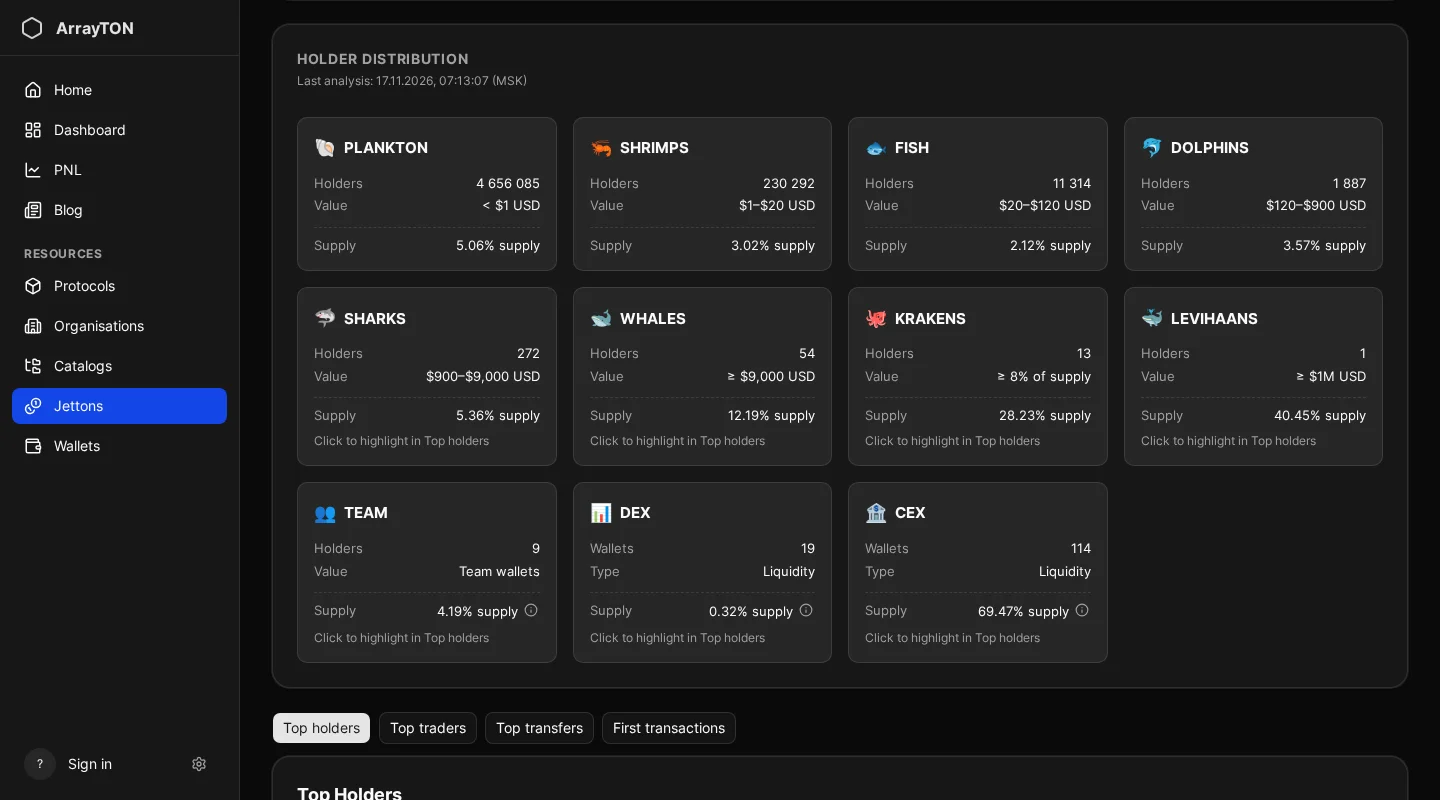
The Holder distribution block splits holders into size bands by the value of their position, from small to large: plankton, shrimps, fish, dolphins, sharks, whales, krakens and levihaans. In USD terms plankton hold under $1, shrimps $1–20, fish $20–120, dolphins $120–900, sharks $900–9,000 and whales $9,000 or more; krakens hold at least 8% of supply and levihaans at least $1M. Separate cards show team, DEX and CEX wallets.
Each card shows the number of holders and the share of supply. In the DOGS example, one levihaan wallet holds 40.45% of supply and CEX wallets together hold 69.47%. Much of that supply sits in exchange custody rather than in a single private wallet, which is a different risk from a hidden whale.
How to read it:
- A large share in a few whales, krakens or levihaans means a few wallets can move the price.
- A large DEX share is normal (liquidity). A large team share raises the question of unlocks.
- Team, DEX and CEX percentages are computed separately from the size bands, so they can overlap with other cards. They are not meant to add up to 100%.
Click a card to highlight those wallets in the top holders table. The analysis is a snapshot with a “last analysis” time; a re-run is available only if the last one finished more than an hour ago.
Step 5. Check the top holders
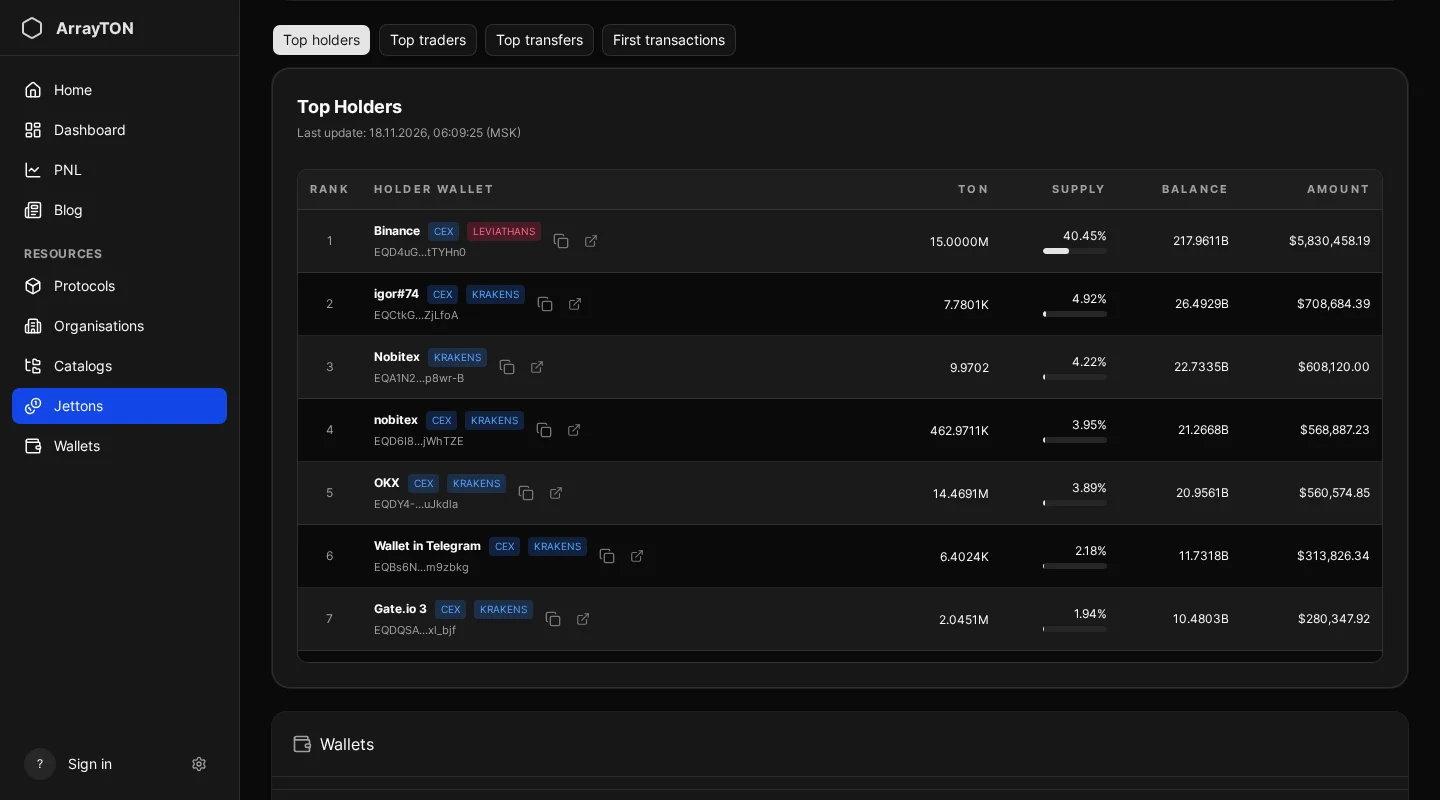
Under the distribution there are four tabs: Top holders, Top traders, Top transfers and First transactions. Top holders lists rank, holder wallet, TON balance, share of supply and the token balance with its USD value. Wallets carry labels such as an exchange name, a CEX tag and a size role (KRAKENS, WHALES). Open the biggest wallets and see whether they are exchanges, liquidity pools, the team or anonymous addresses; a labelled wallet is explained on its own page, see how to analyse a wallet. A switch at the bottom shows wallets with a balance of $10 or less.
Step 6. Find out who trades it
Holders show who owns the token. The other three tabs show who moves it: the most active traders, wallets that only transfer, and the very first swaps ever made. They are covered in who trades a jetton.
Six-point checklist
- No Scam label; Verified if you expect the official jetton.
- Admin Burned, or a clear reason why the admin still exists.
- Top 10 wallets are mostly pools, exchanges or known entities.
- No unexplained single wallet with a large share.
- The chart does not show a single spike that never recovered.
- Description, links and the protocol or organisation behind it are filled in.
Frequently asked questions
Is a jetton with Admin Burned always safe? No. It removes one risk (changing the contract) but says nothing about concentration or liquidity.
Why does FDV differ from other sites? It is estimated from the current total supply, see Step 3.
Why is the distribution outdated? It is a snapshot. Check the “last analysis” time on the card.
This guide is analysis methodology, not investment advice.
Next step
Continue with who trades a jetton.